NFHS Policy Tracker for Districts
Using the district factsheets from the National Family Health Surveys (NFHS-4 and NFHS-5), we present an interactive dashboard to visualize health, nutrition, and population indicators across India. Through this dashboard, users can visualize and analyze NFHS-5 (2019-21) data, as well as change between NFHS-4 (2015-16) and NFHS-5 for the districts of India. Users can further filter visualization and analysis by:
- Aspirational Districts
- Survey Phases of NFHS-5
- States/Districts
The aim of this interactive data resource is to inform design of policies and enable prioritization of districts for intervention in the domains of health, nutrition and population. This dashboard was created in collaboration with the National Institution for Transforming India (NITI) Aayog and the International Institute for Population Sciences (IIPS).
Underscoring the relevance of the dashboard, Dr. Rajiv Kumar, Vice Chairman of NITI Aayog, notes
"Insights gained from this data will sharpen our understanding of how specific policies such as Poshan Abhiyan or the Aspirational Districts Program are working to improve these vital indicators. I believe this resource will enhance our efforts towards precision, data-based governance by giving policymakers an unprecedented lens through which they can guide new interventions and prioritize the communities where the need is greatest."
GEOGRAPHIC VISUALIZATION
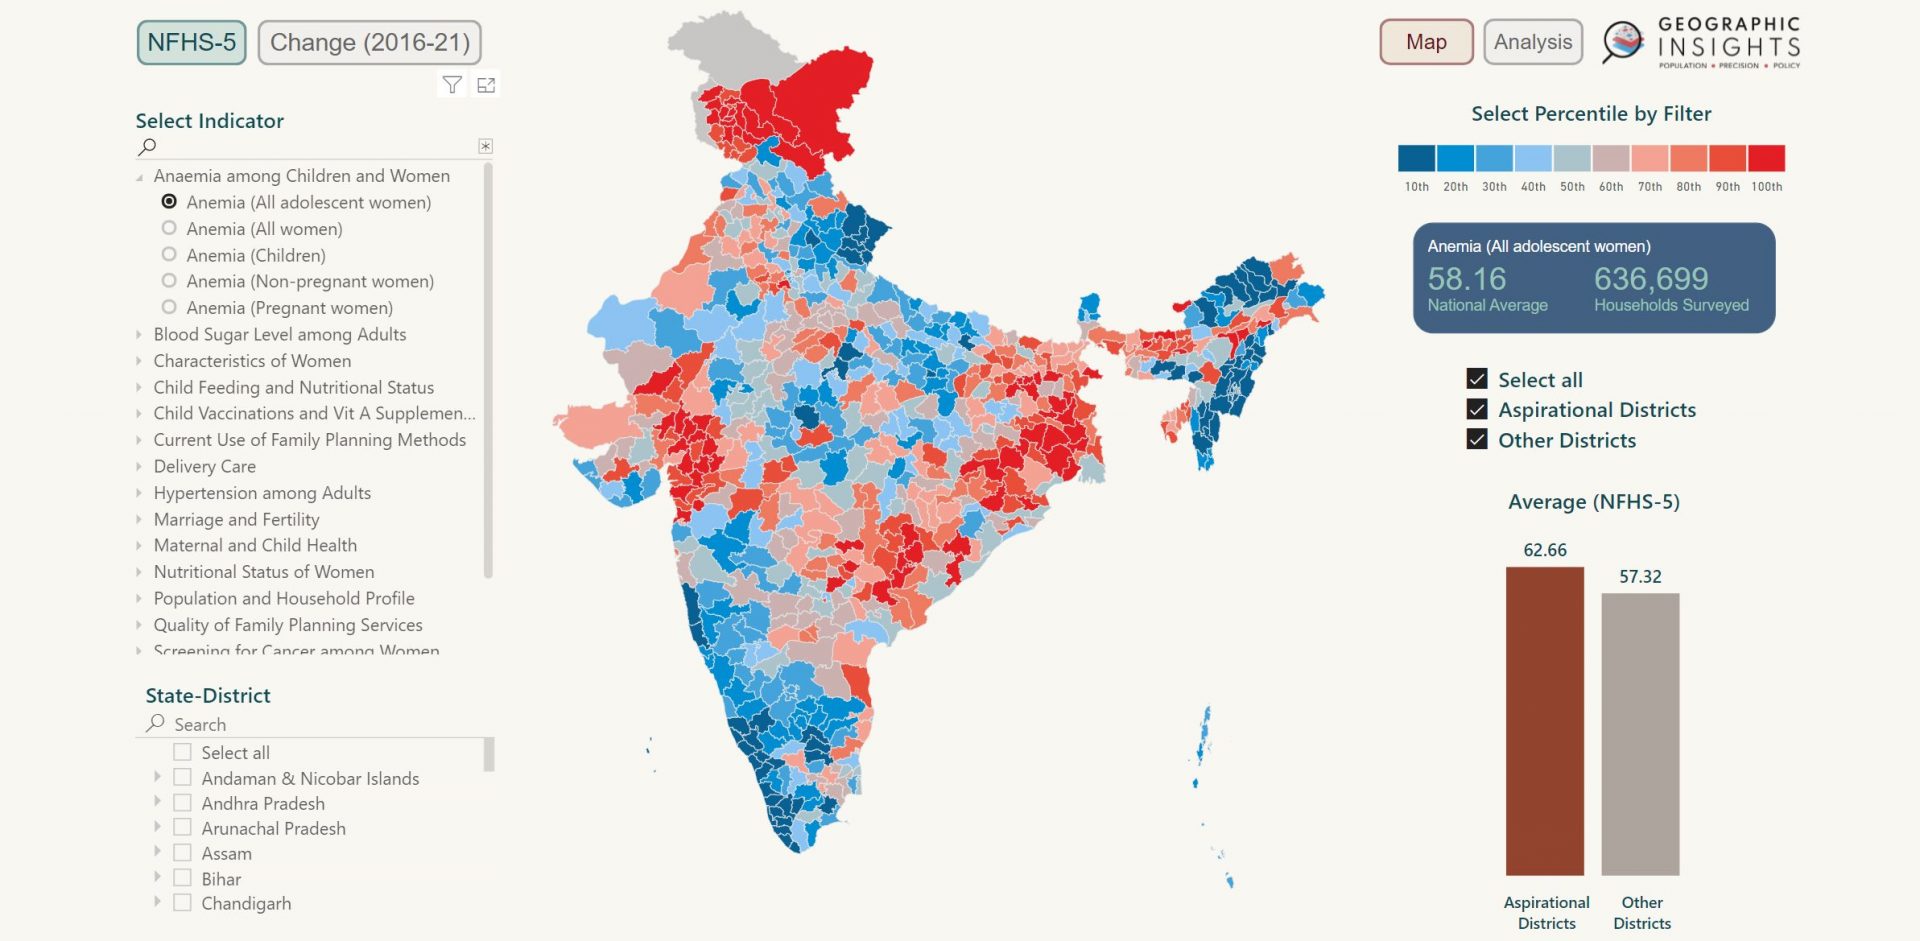
NOTE: To visit the Geographic Insights Lab, please click on the image.
NOTE: To visit the Geographic Insights Lab, please click on the image.
TECHNICAL NOTES
For a full screen view of the Geographic Visualization, see this link: https://geographicinsights.iq.harvard.edu/nfhs-tracker-districts-dashboard and for a full screen view of the Analysis, see this link: https://geographicinsights.iq.harvard.edu/nfhs-tracker-districts-analysis.
For more information on the data sources and methodology, see here.
Citation: Geographic Insights Lab. NFHS Policy Tracker for Districts. 2021. Harvard Center for Population and Development Studies and Center for Geographic Analysis at Harvard, Cambridge MA, USA.
Notes
- Districts that had less 24 or less unweighted cases for an indicator had no value in the district factsheets published by IIPS. Districts that had between 25-49 unweighted cases for an indicator are marked as "Unreliable Estimate" on our dashboard.
- In the percentile and change filter, use CTRL (on Windows) and CMD (on Mac) to select more than one percentile/change category.
- The 10th percentile represents the districts below the 10th percentile; the 20th percentile represents districts between the 10th and 20th percentile, and so on.
- Some correlation coefficients may not be displayed due to a low number of districts that have available data for an indicator.
- For best performance, use Google Chrome on desktop.